85% Gen Z
73% Millennials
66% of all traders
...regret impulsive and emotionally charged decisions in trading on stock markets. Majority is making better results relying on systems.
Source: CNBC
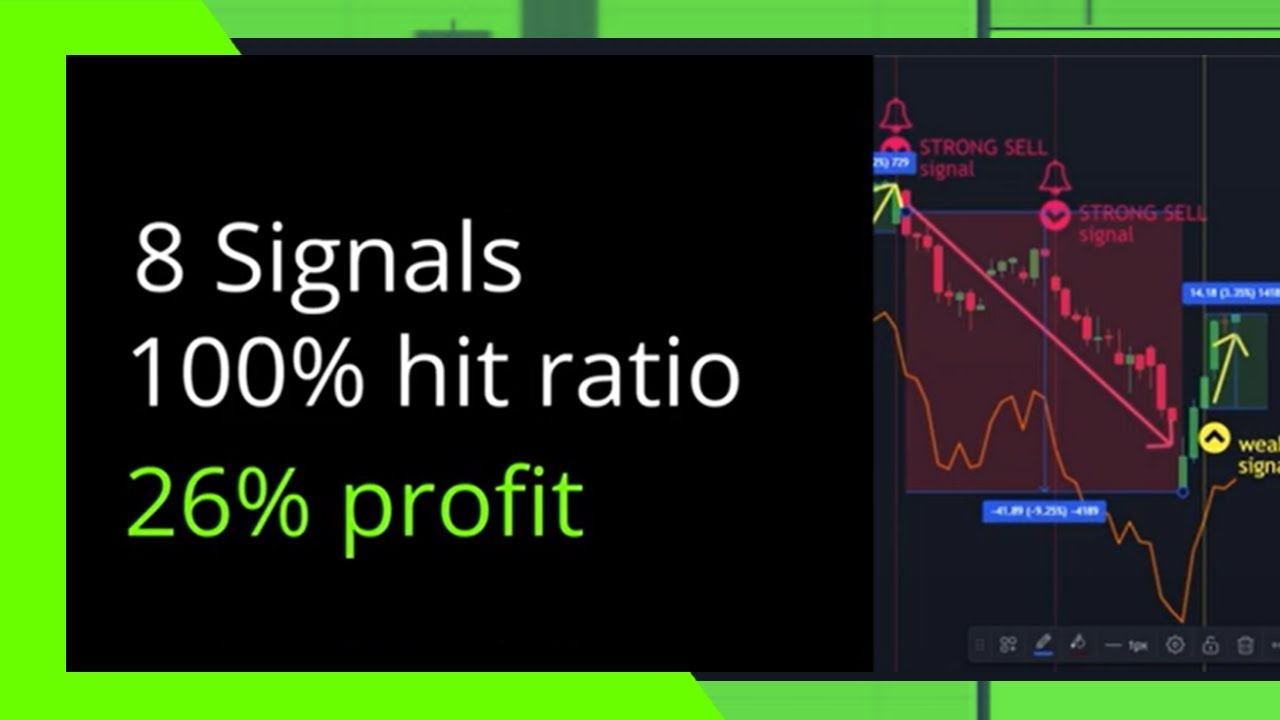
Our dashboards help you to de-emotionalize!
REAL DATA &
financial advice on Social Media like TikTok, Instagram, Discord, Reddit...
Social Media is transforming the trading world. However, >90% of traders fail. (Source: NASDAQ, FORBES)
There are thousands of "Gurus" on basically all social platforms providing advice, services, insider tips and magic strategies in how to beat the market and identify tenbagger stocks, ETFs, options and other securities.
Nothing wrong with getting inspiration and additional perspectives on social channels. However, for long term success you will need to supplement it with your own research and analysis.
Here is an interesting article: CNBC
We help you to make more educated and data driven decisions!
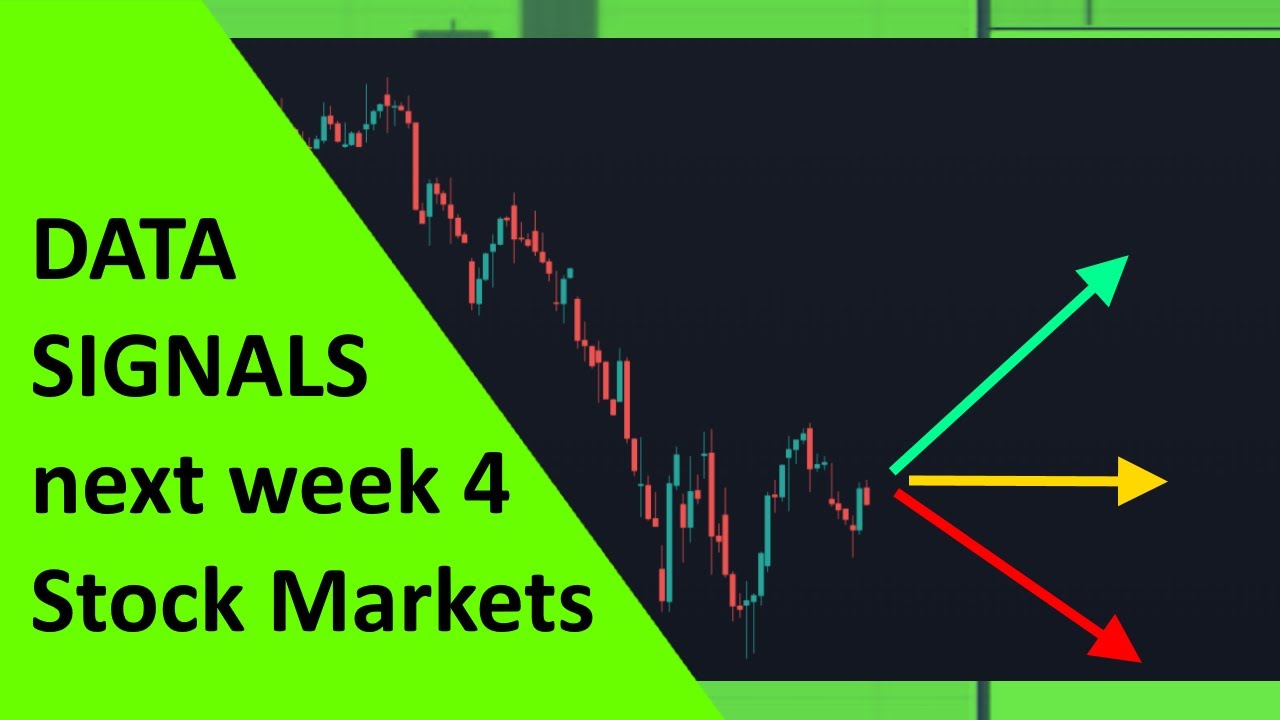
What is the current stock market doing today?
-
Get instantly the latest stock market news in data format
Our solution is fueled with data from the largest US exchange platforms such as CBOE, NYSE, NASDAQ... We aggregate and visualize data that describes:
-
VOLATILITY (VIX VIX9d VIX3M, VIX6M VIX1Y, VVIX, VOLI, volatility of widely traded indices such as S&P500, DJIA, Russel2000...)
-
OPTIONS market positioning (Put Call Ratios of indices and volatility ETPs)
-
ADVANCE DECLINE Ratios on NYSE and NASDAQ
-
MARKET BREADTH McClellan oscillator
-
INSIDER Trader Activity
-
TREASURY/Bond Yields (IRX, FVX, TNX, TYX...)
-
ECONOMY KPIs such as GDP, CRB, CPI, PP...
-
SEASONAL PATTERNS
We merge this data in instantly graspable formats (barometers) and visualize its dynamics. With this information traders can easily and conveniently understand in what situation they are in and navigate their portfolios through all market conditions in an educated approach, which also helps to manage emotions.